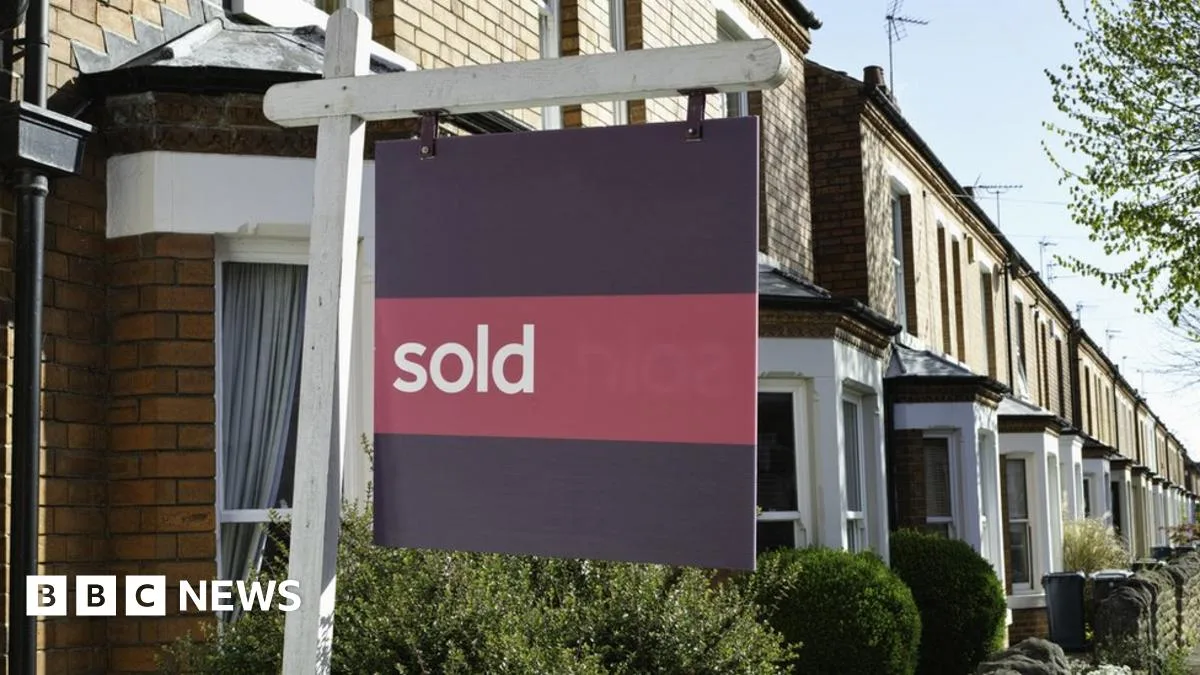
House prices in Northern Ireland surged 9% in the three months to June compared to the same period last year, marking the largest annual rise since 2007 and the biggest quarterly increase since 2016, according to official figures from the Northern Ireland Statistics and Research Agency.
The average price now stands at £153,449, ranging from £134,091 in the Armagh City, Banbridge and Craigavon Borough Council area to £180,067 in Lisburn and Castlereagh City Council. The Causeway Coast and Glens Borough Council area saw the steepest annual rise at nearly 17%.
A total of 7,187 residential properties were sold between March and June. The housing market had been effectively paused during the same period in 2020 due to lockdown, creating a build-up of demand. Estate agent Judith Gilchrist described the last quarter as 'manic', with properties attracting multiple bids above asking price.

However, housing expert Prof Paddy Gray of Ulster University warned that rising prices could force some into sub-standard housing. 'House price rises create confidence for people who already own, but there is an element who just can't afford to get on the property ladder,' he said, noting that Northern Ireland still has thousands on the social housing waiting list.
First-time buyer Elaine Crory, 41, has been renting for over 20 years and saving for a deposit in west Belfast. Despite having nearly 10% saved, rising prices have pushed her goal back years. 'The window is closing, the pressure is really on,' she said, lamenting that her children have never had a garden.