
A startling new heat map has laid bare the vast economic chasm separating different parts of the United Kingdom, revealing a pronounced North-South divide in disposable income. The data provides a stark visual representation of where Britons feel the greatest financial pressure and where they enjoy the most economic freedom.
The Wealth Hotspots: London's Dominance
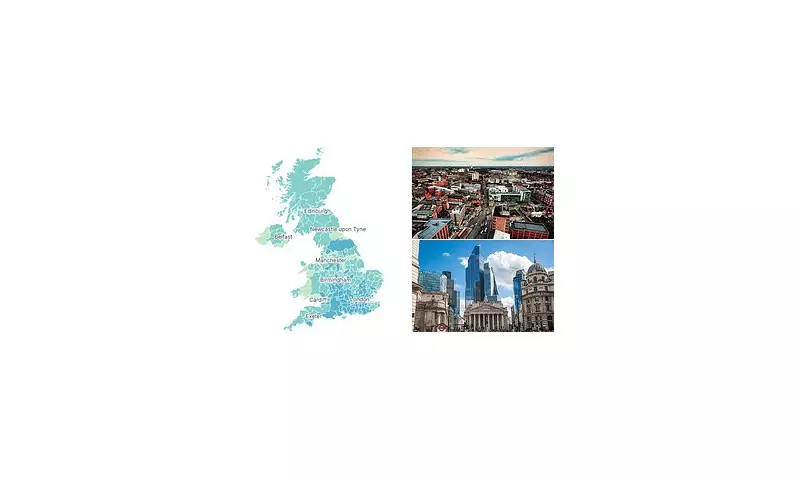
The map illuminates the City of London and the London Borough of Westminster as the UK's undisputed financial powerhouses. Residents in these areas boast the highest disposable incomes in the nation, a testament to the concentration of high-paying finance, professional services, and corporate headquarters in the capital.
This affluence extends into the wider South East, creating a distinct cluster of wealth that contrasts sharply with other regions.

The Struggle in the Regions
At the other end of the spectrum, the analysis identifies several areas facing significant financial challenges. Nottingham, Wales, and the North East of England emerge as regions where households are left with the least amount of disposable income after accounting for taxes and essential living costs.
This geographic disparity highlights the persistent economic imbalance that continues to shape life opportunities across the UK.
What is Disposable Income?
Disposable income refers to the amount of money households have available to spend or save after income taxes, council tax, pension contributions, and National Insurance have been deducted. It is a crucial indicator of economic well-being, showing what remains for leisure, savings, and discretionary purchases.
Implications of the Divide
This geographical wealth gap has profound implications beyond monthly budgets. It influences:
- Quality of Life: Discretionary spending power directly affects access to leisure, culture, and holidays.
- Health Outcomes: Areas with lower disposable income often report poorer health statistics.
- Social Mobility: The data suggests a 'postcode lottery' for economic opportunity.
- Local Economies: Regions with lower disposable income see less money circulating in local businesses.
The visual representation of this data serves as a powerful tool for policymakers, economists, and the public to understand the true landscape of economic inequality in modern Britain. It raises critical questions about regional development strategies and the need for balanced economic growth across all parts of the UK.