New interactive maps, powered by data from the 2001, 2011, and 2021 Censuses, have revealed the profound transformation of England and Wales's population over the last two decades. The extraordinarily detailed graphics lay bare the changing face of every neighbourhood, driven by record levels of immigration.
Mapping Two Decades of Change
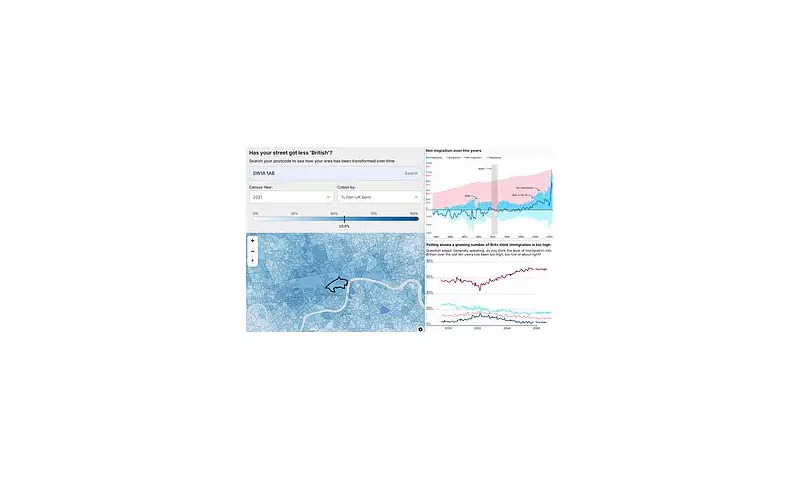
The analysis allows users to type in their postcode and see how their local area has evolved, based on key metrics like national identity and country of birth. The data plots changes across all 34,000 lower super output areas (LSOAs) in England – small geographical pockets containing between 1,000 and 3,000 residents.
One of the most striking findings is the surge in areas with a majority foreign-born population. In 2001, only 0.6% of neighbourhoods had more than half of residents born outside the UK. By 2021, this figure had risen seven-fold to 4.2% of areas.
Conversely, the proportion of areas where most people did not speak English as their main language fell, from 0.37% in 2011 to 0.13% in 2021. Experts caution that direct comparison with 2001 is impossible for national identity and language, as those questions were not included in the census that year.
Localities Transformed: Handsworth and Leicester
Experts argue the data shows some communities have changed so drastically due to high immigration they are now unrecognisable to long-term residents. Alp Mehmet of Migration Watch stated, 'Many parts of the country now have a majority ethnic-minority population, some of them even mono-ethnic.' He warned that at current migration levels, integration is impossible and social cohesion is under threat.
The Handsworth area of inner-city Birmingham was highlighted as one neighbourhood that has undergone significant demographic change. It drew national attention in October after Conservative shadow justice minister Robert Jenrick was recorded calling it a 'slum' and noting a lack of integration.
The census data reveals the scale of change in parts of Handsworth, with 36% of residents in some pockets not using English as a main language and a similar proportion not identifying with any UK national identity.
Leicester, a city with a long history of immigration, dominates the rankings for areas where English is least spoken as a main language. In 2011, it contained 15 of the top 20 neighbourhoods nationally with the fewest English speakers, with rates as high as 68%. By 2021, it had 16 of the top 20, with non-English speaker rates spiralling to 70% in some areas.
Leicester was declared one of the UK's first 'super-diverse' cities in 2022. However, some residents express concern. One local woman, named Emma, told the Daily Mail she felt unsafe as one of the few white women in her area, describing it as segregated and claiming social integration had broken down over the past decade.
Policy Responses and Future Challenges
These detailed demographic insights come after years of record net migration, which peaked at 1.47 million in the year to March 2023. In response to public concern and political pressure, Home Secretary Shabana Mahmood recently announced a major overhaul of the asylum system.
The new Labour plan includes making refugee status temporary, subject to review every 30 months, and extending the wait for permanent settlement to 20 years. It will also restrict rights to family reunion and curb financial support for those awaiting claims. Judges will be instructed to limit the use of Article 8 of the ECHR (right to family life) to block deportations, though the UK will remain a member of the convention.
The newly published maps provide an unprecedented street-level view of the UK's evolving identity, fuelling an ongoing national debate about immigration, integration, and the future shape of British society.