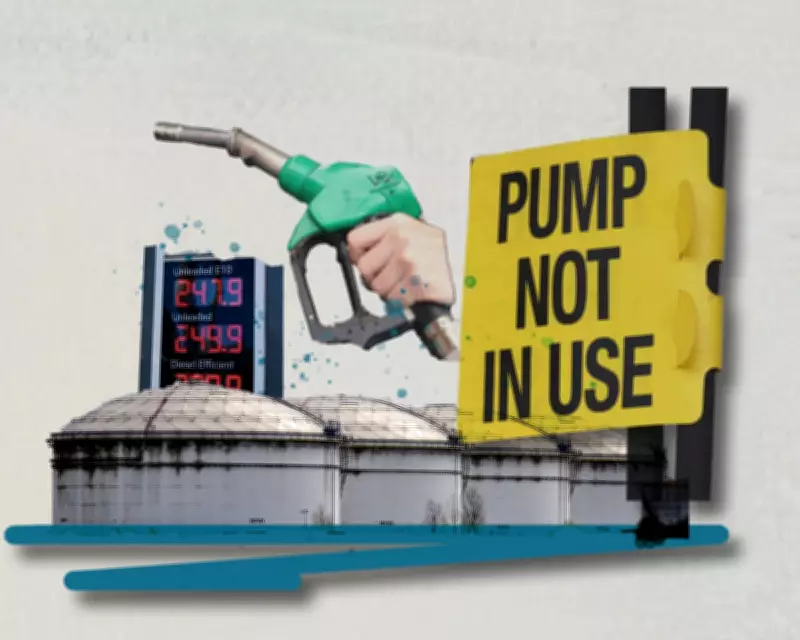
Australia's Fuel Crisis: A Comprehensive Data Analysis
Australia is currently grappling with a severe fuel crisis, driven by geopolitical tensions and supply chain disruptions. This article provides an in-depth look at the situation through real-time data, charts, and analysis, helping you understand the full scope of the issue.
Tracking Fuel Prices and Availability
Use our interactive fuel tracker to check petrol and diesel prices across the country, monitor how many service stations have run out of fuel, and estimate how long Australia's reserve supplies will last. The crisis has been exacerbated by the closure of the Strait of Hormuz by Iran, following the US and Israel's war that began in late February. This strategic chokepoint previously handled about a fifth of global oil shipments and a third of fertilisers, making its disruption a critical factor in the current shortages.
Hundreds of service stations nationwide have reported empty tanks, while fuel prices have surged to elevated levels. Additionally, multiple oil shipments to Australia have been cancelled or deferred, with experts warning of further delays. The federal government has responded by releasing fuel reserves, cutting excise taxes, and implementing a national fuel security plan to mitigate the impact.

Data Insights on Outages and Prices
Since data collection started on 27 March, there has been a noticeable spike in fuel outages, particularly in New South Wales and Victoria on 30 and 31 March. The map below illustrates the number of outages day by day, allowing users to hover over stations for detailed views and click through dates for historical data. It's important to note that outages are not static; stations can run out and restock as supply chains are adjusted and more fuel is released into the market.
Looking at average prices for petrol and diesel across Australia, charts reveal significant increases since the conflict began. However, there is considerable variation in price and availability, even within small geographic areas, due to the involvement of thousands of independent businesses and different state governments.
Fuel Shipments and Reserve Levels
The next chart displays the total number of "port calls" at Australian ports by tankers carrying fuel and crude oil, which is refined into usable products. Data shows a slight decline in tanker arrivals in February and March compared to the past six years, with a complete collapse in traffic through the Strait of Hormuz in early March. This underscores the global impact of the conflict on fuel logistics.
In response, the federal government reduced the minimum stock levels that fuel companies must hold for emergencies. A weekly snapshot chart compares current fuel reserves to these new minimums and estimates how long they would last at normal consumption rates. Interestingly, as of early April, Australia's fuel reserves, measured in days of supply, had actually increased from pre-war levels, indicating some success in stabilization efforts.
Data Sources and Methodology
All data is sourced daily from government fuel websites and APIs, with average petrol, E10, and diesel prices provided by Motormouth. Some government data is live, while other updates are delayed or triggered by price changes. Victoria, Queensland, South Australia, and the Northern Territory explicitly indicate fuel availability in their reports. For New South Wales and Tasmania, outages are estimated based on typical fuel types carried by stations. Western Australia's data uses temporary outage dates, with historical data from Fuelwatch for 26 to 30 March.
Daily outage counts are summed from the map data, and tanker information comes from Portwatch at the University of Oxford, using IMF data. This page will be updated continuously as the fuel crisis evolves, with any corrections footnoted in line with editorial standards.