Convenience sales grew 0.6% this year against 2.9% inflation, so independents need more from the shelf they already have. Symbol groups and suppliers hold the store-level data that could help, and too little of it reaches the shopkeeper as a decision.
The Association of Convenience Stores published its 2026 Local Shop Report on 7 September, and Talking Retail’s coverage led on the cost squeeze. Sector sales are forecast at £49.1bn for 2026, up 0.6% on last year, while inflation averaged 2.9% over the same 12 months.
Investment by convenience retailers, above £1bn in 2024, has fallen back to around £900m a year. ACS says retailers are cutting staff hours, covering more shifts themselves and delaying spending.
The shelf has to do more of the work
Independents run 71% of UK convenience stores, according to the ACS 2025 report. With investment flat and sales barely moving, the cheapest growth left for most of them is the range they already stock.
TWC’s analysis of the same report put the average store at roughly 1,200 to 1,300 sq ft carrying around 4,580 SKUs. That is a lot of lines for one owner to judge by eye while covering extra shifts. TWC also found independents underperforming in fresh food, chilled ready meals and food to go.
Some categories move too fast to judge by eye at all. Talysis counted more than 2,000 new vape barcodes in 2025, and its Q1 2026 data showed tobacco and smoking alternatives down 4.4% in value while oral nicotine grew 42.5%.
Who already holds the data?
Most of it sits with the groups and the data panels. The Fascia Guide notes that most groups run their own EPoS. One Stop has rolled a new system across 900 core and franchise stores.
TWC’s SmartView panel reads EPoS from about 6,500 independent and symbol stores with a combined turnover of £5.6bn. So the information exists to tell a retailer which of their 4,580 lines are earning their space, which are missing compared with similar stores nearby, and which have stopped scanning. What usually comes back to the store is a promotional calendar and a planogram built for the average shop in the estate.
What symbol groups can do with it
Nisa’s relaunch in March, reported by Talking Retail, removed charges and added in-store screens carrying supplier programmes. Delivery raises the stakes on stock accuracy. When Gander integrated with ShopMate in February, the aim was to share live availability with local shoppers across more than 4,200 ShopMate retailers.
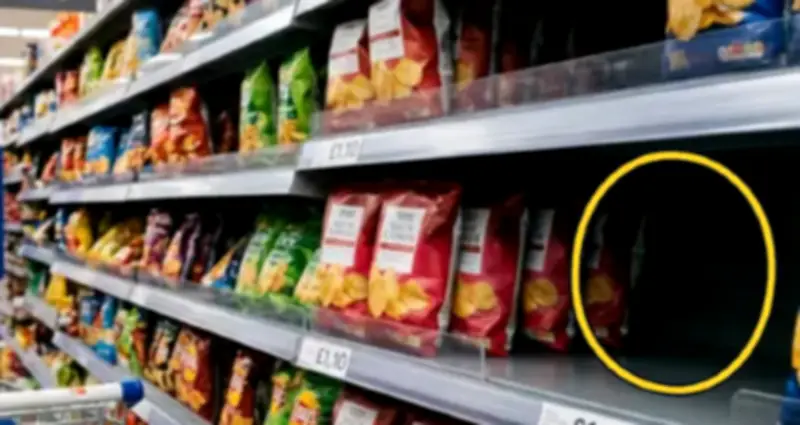
An app that reads EPoS stock will list a product the shop does not have if the system count is wrong. That gap is phantom inventory: stock the system says is there and the shelf says is missing. The practical step for a group is to send each store a short list built from its own EPoS: lines that sell in comparable stores and are not ranged here, and ranged lines with no scans for two weeks.
What suppliers can do
Suppliers fund much of what independents receive through a symbol group, including promotions. They also rate the groups that carry them: JW Filshill topped The Advantage Group’s supplier survey of wholesalers and symbol groups for the 16th year running in 2026. Suppliers can ask for better data in return, and use it.
An illustrative example. A snacks brand is ranged in 800 symbol stores and depot shipments look steady. Store EPoS shows 120 of them have not scanned its best-selling line in a fortnight. If the line normally sells £25 a week per store, that is £3,000 a week, or £156,000 over a year, from one line. A rep plan built on depot data would miss it, because the depot keeps shipping to the stores that are still selling.
Ranking gaps by cash is how we work with store-level availability data at GrowSights for brands in the major supermarkets, and the same arithmetic holds for a symbol estate. Not every gap is recoverable. Some stores drop a line because it does not suit their customers, and Nisa is clear that its retailers still run their own businesses. A good list separates “not ranged by choice” from “ranged but not selling”, and only chases the second.
What the best partnerships do differently
They send data back in a form a retailer can act on in ten minutes: one list per store, ranked by lost sales, with the line, the gap and the likely cause. They treat a zero-scan line as a stock question before a range question, because an empty shelf and a weak line look identical in a sales report.
Where depot shipments, store EPoS and the brand’s own ERP disagree, they reconcile those conflicting stock figures before deciding which it is. They check stock in promoting stores in the first week of a deal, while there is still time to fix it. They agree core range by store type and catchment, so a commuter store and a village shop get different lists.
Questions worth asking your team this week
Can we see our sales store by store across the symbol estate, or only what the depot ships? Depot shipments can stay steady while individual shelves sit empty. Which stores that range our core lines have recorded no scans in the last 14 days? That list is usually the cheapest sales a supplier can find.
When we last funded a symbol promotion, did anyone check stock in the participating stores in week one? If nobody did, part of that budget paid for a deal shoppers could not buy. What does the retailer get back from the data we take? A shopkeeper covering extra shifts will use a ranked list and ignore a dashboard login.
A 0.6% sales year leaves little room for waste. For the independents running most of the UK’s convenience stores, the next point of growth is more likely to come from lines already ranged and already paid for reaching the shelf and scanning.