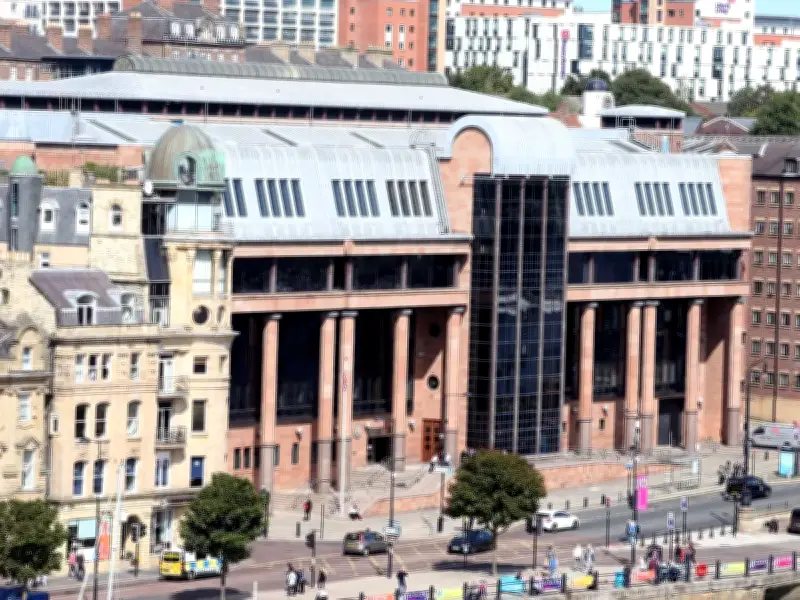
Fresh analysis reveals that the growing backlog of cases at crown courts across England and Wales is not experienced evenly nationwide, with approximately four in 10 courts successfully reducing their caseload during the second quarter of this year.
Two courts – Gloucester and Manchester Minshull Street – managed to slash their backlog by more than 10% between March and June 2026. An additional 11 achieved reductions of between 5% and 10%: Cambridge, Carlisle, Derby, Great Grimsby, Guildford, Kingston upon Thames, Luton, Mold, Newcastle upon Tyne, Salisbury and Worcester.
Mixed picture across 68 courts
In total, 29 out of 68 crown courts registered a decrease in outstanding cases during this timeframe, according to Press Association analysis of Ministry of Justice figures. Some 38 courts experienced an increase and one remained unchanged.
The most significant numerical rises were recorded at London-based courts: Snaresbrook, Isleworth and Woolwich. Newport Crown Court on the Isle of Wight witnessed the steepest percentage increase, at nearly 19%.
Detailed breakdown of case backlogs
Below is a detailed breakdown of the backlog of criminal cases awaiting resolution at crown courts in England and Wales as of June 30 2026. The list is organised alphabetically and shows, from left to right: court name; number of outstanding cases as of June 30 2026; number (in brackets) of outstanding cases as of March 31 2026; numerical change; percentage change.
- Aylesbury 1,200 (1,149) +51; +4.4%.
- Basildon 1,304 (1,306) -2; -0.2%.
- Birmingham 2,574 (2,562) +12; +0.5%.
- Bolton 913 (896) +17; +1.9%.
- Bournemouth 683 (710) -27; -3.8%.
- Bradford 1,659 (1,624) +35; +2.2%.
- Bristol 1,227 (1,197) +30; +2.5%.
- Cambridge 786 (833) -47; -5.6%.
- Canterbury 775 (754) +21; +2.8%.
- Cardiff 1,647 (1,637) +10; +0.6%.
- Carlisle 426 (462) -36; -7.8%.
- Central Criminal Court 756 (682) +74; +10.9%.
- Chelmsford 1,129 (1,112) +17; +1.5%.
- Chester 948 (941) +7; +0.7%.
- Croydon 1,713 (1,736) -23; -1.3%.
- Derby 1,051 (1,109) -58; -5.2%.
- Durham 533 (501) +32; +6.4%.
- Exeter 661 (605) +56; +9.3%.
- Gloucester 365 (427) -62; -14.5%.
- Great Grimsby 262 (284) -22; -7.7%.
- Guildford 1,195 (1,265) -70; -5.5%.
- Harrow 1,381 (1,336) +45; +3.4%.
- Inner London Sessions House 1,859 (1,897) -38; -2.0%.
- Ipswich 901 (909) -8; -0.9%.
- Isleworth 2,799 (2,645) +154; +5.8%.
- Kingston Upon Hull 562 (542) +20; +3.7%.
- Kingston Upon Thames 1,248 (1,326) -78; -5.9%.
- Leeds 2,117 (2,142) -25; -1.2%.
- Leicester 1,427 (1,427) 0; (no change).
- Lewes 1,419 (1,407) +12; +0.9%.
- Lincoln 457 (413) +44; +10.7%.
- Liverpool 1,854 (1,761) +93; +5.3%.
- Luton 956 (1,015) -59; -5.8%.
- Maidstone 1,967 (2,053) -86; -4.2%.
- Manchester Crown Square 1,821 (1,725) +96; +5.6%.
- Manchester Minshull Street 1,969 (2,193) -224; -10.2%.
- Mold 515 (559) -44; -7.9%.
- Newcastle upon Tyne 1,859 (2,011) -152; -7.6%.
- Newport (Isle of Wight) 153 (129) +24; +18.6%.
- Northampton 899 (877) +22; +2.5%.
- Norwich 1,218 (1,220) -2; -0.2%.
- Nottingham 1,876 (1,839) +37; +2.0%.
- Oxford 586 (610) -24; -3.9%.
- Plymouth 553 (527) +26; +4.9%.
- Portsmouth 729 (724) +5; +0.7%.
- Preston 1,911 (1,875) +36; +1.9%.
- Reading 938 (958) -20; -2.1%.
- Salisbury 150 (164) -14; -8.5%.
- Sheffield 1,884 (1,847) +37; +2.0%.
- Shrewsbury 779 (782) -3; -0.4%.
- Snaresbrook 4,588 (4,433) +155; +3.5%.
- Southampton 565 (492) +73; +14.8%.
- Southwark 1,683 (1,696) -13; -0.8%.
- St Albans 994 (1,019) -25; -2.5%.
- Stafford 899 (878) +21; +2.4%.
- Stoke On Trent 757 (755) +2; +0.3%.
- Swansea 656 (670) -14; -2.1%.
- Swindon 272 (256) 16; +6.3%.
- Taunton 456 (430) 26; +6.0%.
- Teesside 1,503 (1,555) -52; -3.3%.
- Truro 385 (331) +54; +16.3%.
- Warwick 1,118 (1,127) -9; -0.8%.
- Winchester 460 (395) +65; +16.5%.
- Wolverhampton 1,871 (1,820) +51; +2.8%.
- Wood Green 2,372 (2,311) +61; +2.6%.
- Woolwich 2,304 (2,206) +98; +4.4%.
- Worcester 815 (860) -45; -5.2%.
- York 457 (423) 34; +8.0%.
The figures highlight significant regional variation, with London courts seeing the largest numerical increases while several regional courts made notable progress in reducing their backlogs.